Assigning data to a thickness map
On the Assign Data form you select the events for the creation of a thickness map. The input can consist of 'dense' surfaces in the form of 2D grids and tri-meshes available in your Surface Set or Seismic Interpretation, or markers available in your Marker Set.
To assign data to your thickness map
- On the Assign Data form, select the thickness map from the Thickness map drop-down list.
- Output Select the type of the output map, either only isochore map (TVT) or isochore and isopach map (TVT and TST).
- Select the source(s) that contains the events that you want to assign. The Surfaces from and the Markers from drop-down lists show the sources that contain the events that you can use as input to your thickness map. Surfaces from can contain Seismic Interpretations and Surface Sets.
- Top Event and Base Event
- For more information on creating a thickness map using a surface and a marker, see How surface-to-marker thickness is calculated.
- For more information on creating a thickness map using two markers, see How marker-to-marker thickness is calculated.
- Area
- Reference Dip/Azimuth
Specify a reference surface. When you select 'surface and marker' as input, then the dip of the specified reference surface is used only for the TST calculation. When the 'marker and marker' combination is selected as top and base events, then the dip or azimuth of the reference surface is used for both the TST and TVT calculation. For the 'marker and marker' combination the reference surface is used only when your input markers do not have dip and azimuth properties available in the JewelExplorer under Well Data > Marker Sets.
Surfaces from Select a Surface Set or a Seismic Interpretation from the drop-down list. The selection you make here acts as a filter for the next drop-down, Surface.
Surface Select a surface from the drop-down list.
- Faults
- Click Apply to assign the data and keep the form open, or click OK to assign the data, close the form and open the next form in the workflow, Refining your selection. If you are not using a marker set to create your thickness map, this step is automatically skipped
If you only plan to use markers, you can leave Surfaces from empty; if you only plan to use surfaces, you can leave Markers from empty.
Select your top and base event from the list. Depending on the selected source (step 2), select either Surface or Marker as type. Depending on the Type selection the Event drop-down lists are populated with the events as shown on the table:
| Type selected | Event drop-down list populated with |
|---|---|
|
Surface |
2D grid or tri-mesh representation |
|
Marker |
Marker of the type horizon, intrusion or unconformity |
The position, lateral extent and resolution of the anticipated thickness map is defined by an area. You can either select an existing area from the Area drop-down list, or click on the plus sign (  ) to create a new area, see Using the Area Tool. The best results are expected when the area corresponds to the anticipated modeling parameters. You can derive your area from an existing item (e.g. a 2D grid) to align with the existing objects by selecting Autofill parameters. If the area selection stretches beyond the data coverage, the thickness map will be empty in these regions at first. These sections will be filled with values in the interpolation step.
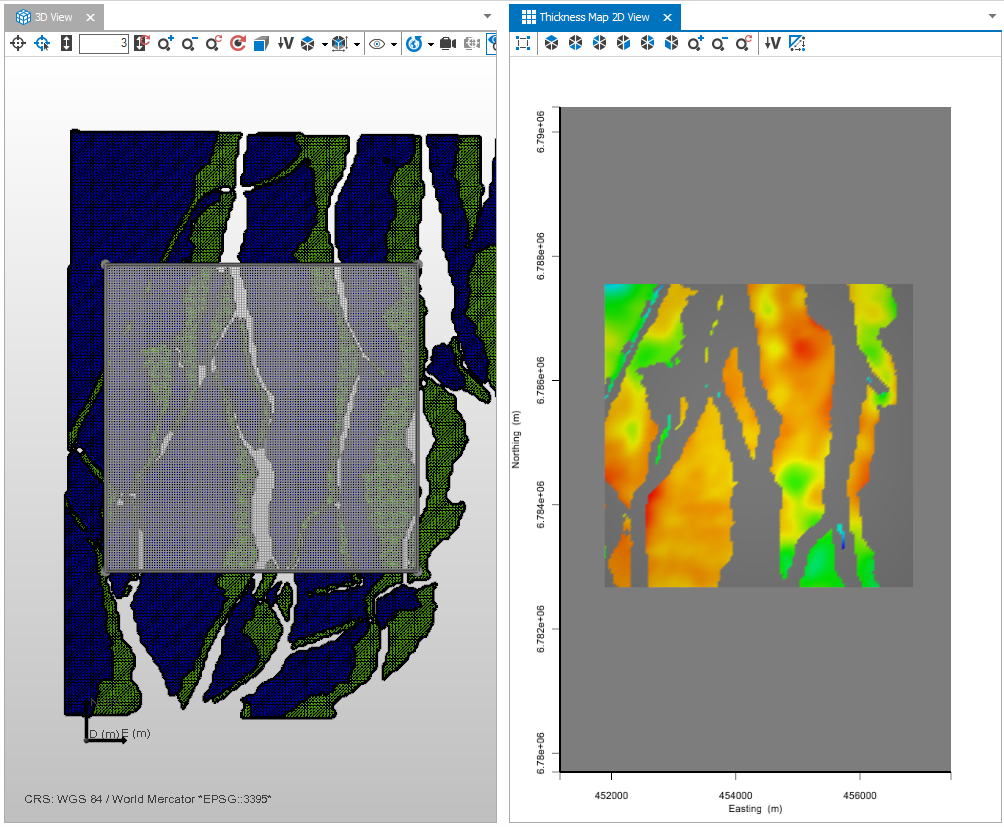
Image showing a collage of a 3D View (left) with the input surfaces and the selected area. The view on the right shows the dedicated Thickness Map after the assign data step. In the Thickness Map View, the calculated thickness is shown between the two dense surfaces. This input is calculated only for the location of the area, using the resolution of the area click to enlarge
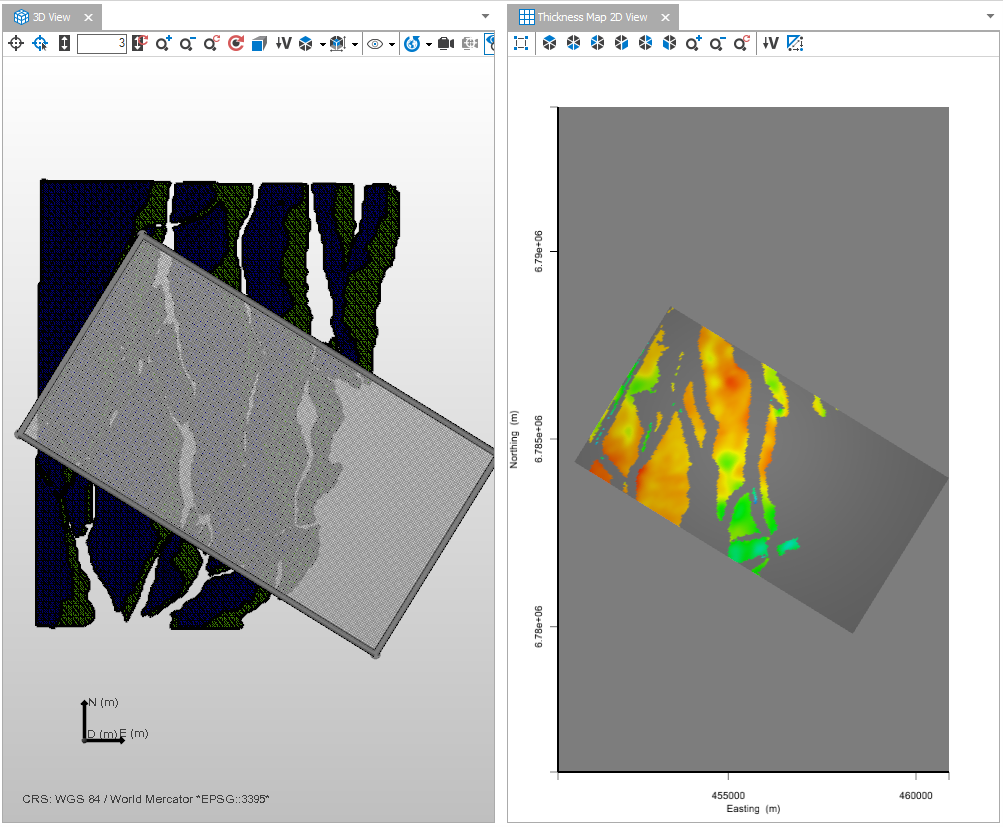
Image showing a thickness map that is rotated and stretches beyond the input data. The workflow will create a thickness map for the selected area. After the assign data step, the locations in which a thickness can be calculated are colored in with values. Undefined sections remain gray until interpolated with values (Interpolate Map) click to enlarge
Select whether or not to honor a fault model. From the drop-down list, select a fault model or leave it set to None in case you want to see the effect of apparent thicknesses.
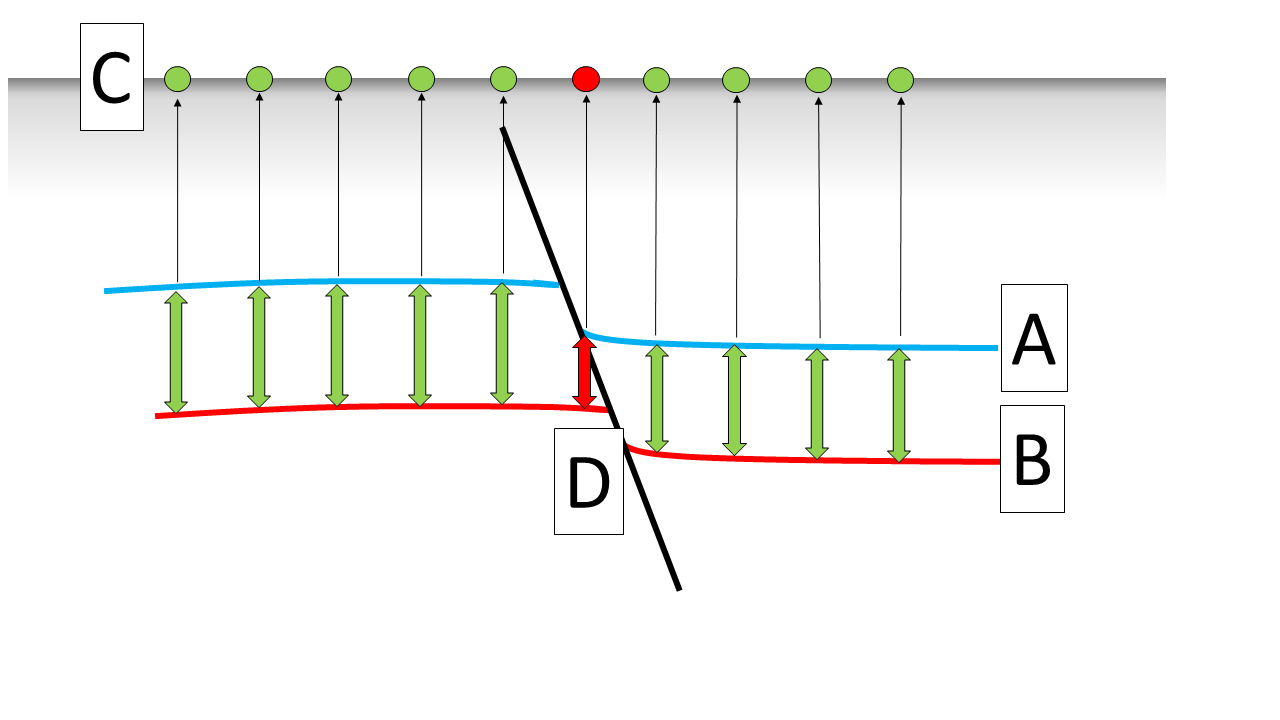
In case a thickness map is generated between a top surface (A) and a bottom surface (B), the thickness values generated (C) may be affected by faulting. This image is an example where a normal fault (D) offsets the zone between the selected events. As a top and base reference is present, a thickness value can be obtained at the position D, which is however an apparent thickness. You can choose to exclude apparent thicknesses by selecting a fault model. The nodes at the top (C) mark the projected thickness values of the thickness map. click to enlarge
If you select to honor a fault model, then the locations on which the thickness values are obtained by projecting through a fault are excluded from the map and set to undefined. If the selected fault model was used
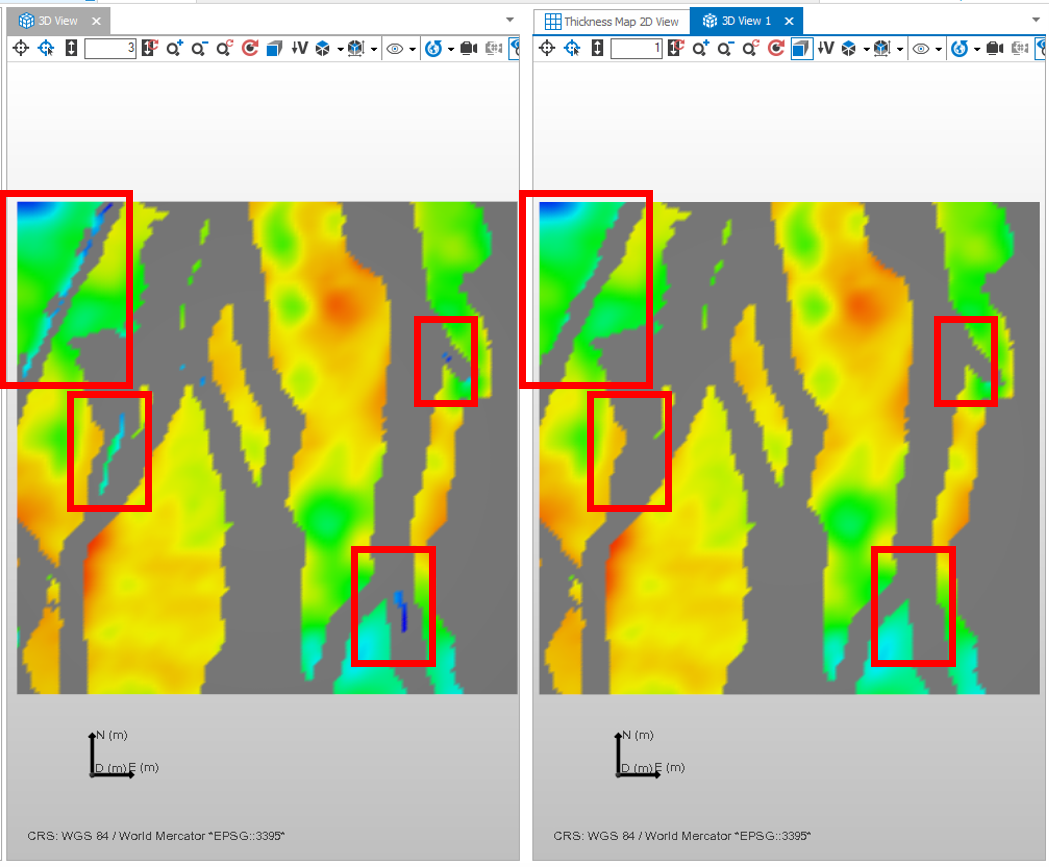
Side by side comparison of two thickness maps generated from the same input, prior to interpolation. The left view shows the thickness map that is generated without honoring the fault model. Here, some locations show low values which are apparent thicknesses caused by normal faults. The view on the right shows a thickness map that was generated while honoring the fault model. Here, the values which are projected through any of the contained faults are excluded, leading to a more homogenous thickness distribution. click to enlarge
- If you selected two dense surfaces as input for your thickness map, the thickness map is now available as a 2D grid under the selected thickness map in the JewelExplorer. The 2D grid contains the calculated thickness property, which is based on the input surfaces only. The thickness property is not interpolated yet for the assigned area.
- If you selected a dense surface and a marker as input for your thickness map, the calculated thickness is displayed at the marker locations in the Thickness/Trend Map, but the thickness property is not generated yet. For more information, see How surface-to-marker thickness is calculated.
- If you selected two markers as input for your thickness map, the calculated thickness is displayed at the marker locations in the Thickness/Trend Map, but the thickness property is not generated yet. For more information, see How marker-to-marker thickness is calculated.